
Overview
There are many ways to analyse forecast accuracy in IFP in both numerical and graphical format.
Many analyses are based upon simple variances between actual data and a single forecast. Typically, this would look at variances between actual data for each month of a selected period and the corresponding forecast created at a single point in time, e.g. many analyses would look at variances between monthly actual data and planned values created at the end of the previous year (see Actual vs Forecast Variances below).
However, the formal measurement of forecast accuracy normally involves comparison of actual data with corresponding forecast data at a specified lag, typically 2 months. For example, the demand forecast for March 2012 made in January 2012 would be compared with the actual data for March 2012 (see Forecast Accuracy below).
See Maintaining Forecast Accuracy Reference Files for details of how to maintain reference files used in analyses of forecast accuracy.
Actual vs. Forecast Variances
To produce this type of analysis:
- From IFP Home, select Reporting > Analysis vs. Time
- Select the actual demand file (file #1) and relevant forecast file (file #2)
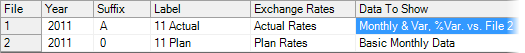
- Select Data to Show = Monthly & Var. % Var vs. File
- Select any combination of items at any level of detail
This produces an analysis as follows: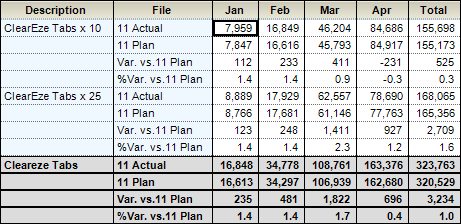
In this type of analysis each monthly actual value is compared with a single forecast made in the prior year.
Percentage variances are computed from 100*(Actual-Forecast) / Forecast.
Forecast Accuracy
To produce this analysis:
- From IFP Home, select Reporting > Analysis vs. Time
- Select the relevant forecast file (file #1) and actual file (file #2)

- Select Data to Show = Month & Forecast Accuracy vs. File 2
- Select any combination of items at any level of detail that does not include sub-totals
This produces an analysis as follows:
In this type of analysis each forecast value from month-2 is compared with the corresponding actual value.
Percentage accuracy is computed from 100*(1 - ABS(Forecast - Actual) / Actual)
Notes:
- the above analysis should be run without sub-totals, e.g. at level of detail = SAP Code
- to force display of zero accuracy values, select the inclusion option Exclude zero lines (otherwise zero accuracy values are display as blank)
Comments
0 comments
Please sign in to leave a comment.