
Overview
When using the Standard Forecast Editor you may choose the view of the data that you wish to see via the following options:
- selecting the data type (units, ASP and/or value) that you wish to enter (sales databases only)
- selecting any report definition that you may wish to use
- selecting the initial level of detail that you wish to use
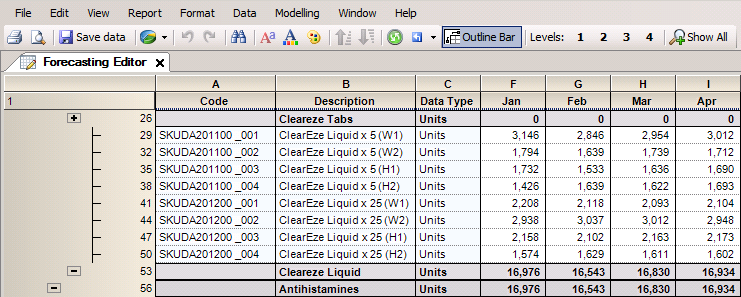
- using the outline bar feature to drill-up/down from the initial view
- changing the Show All Rows option (sales databases only)
- adding graphical views of any selection of rows from the current view
Data Type Options
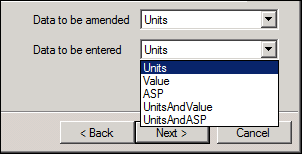
For Sales databases only, you should select the data that you wish to enter for each item. This option determines the initial view that you will see in the editing grid and the cells that you will be able to edit.
Report Definition Options

You may select any report definition to determine the view that you wish to edit. You may use such report definitions with or without explosion by any selected variable (e.g. Analysis by Customer, exploded by brand).
Level of Detail
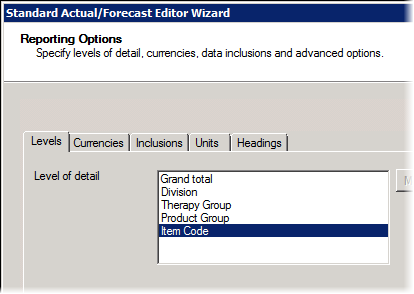
You may select any Level of Detail (e.g. Item Code, Product Group or Division) for the initial view. This determines the lowest level of data that you will be able to edit.
Outline Bar
Once the initial grid has been displayed you may use the Outline Bar option to modify the view that you see.
You may Drill-up or Drill-down to any available level in the report for any selected node using the relevant + and - icons.
Show All Rows
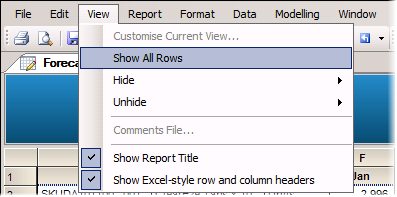
You may set the Show All Rows option to show all data types independently of your chosen option for Data to Enter (sales databases only).
- This does not change which cells you are allowed to edit (this remains as determined by your selected Data to Enter option).
- Selecting View All Rows disables the copy and pasting feature.
Graphical Views
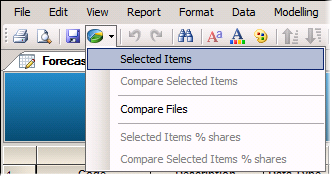
You may add graphs for selected rows using the Selected Items Graph option. Such graphs will be based upon the current values in the editing grid at the point of requesting these graphs. Such graphs are not automatically refreshed as you make further edits to data in the editing grid (this would cause very slow performance).
To refresh such graphs you should close the original graphs and recreate new graphs.
Adding New Reports/Graphs
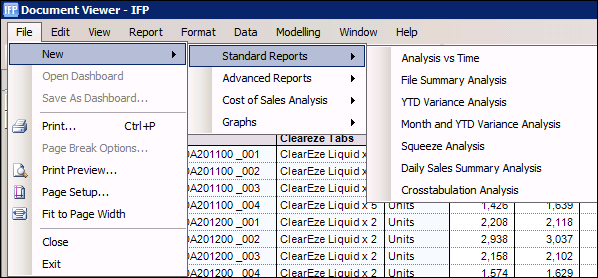
You may add any set of reports and graphs via File > New on the toolbar.
Such reports and graphs may be in any available format for any set of selected items and will be based upon the current saved values in any set of selected files (not just the ones being edited).
For example, you could edit a current year forecast and add reports/graphs comparing this forecast with PY actuals and CY plan. Another example would be to add a report showing current and/or projected inventory data. If these reports/graphs include files currently being edited then to obtain refreshed versions you must save the edited values and then use the refresh button on the relevant tab containing the report/graphs.
Additional reports may be left on separate tabs in the report viewer or dragged so that they may be viewed side by side with the forecasts currently being edited.
Comments
0 comments
Please sign in to leave a comment.