
Prior to using the Graphical Adjustment Toolbar in Statistical Forecasting you must have first Applied the Statistical Forecasting model.
Statistical Forecasting Graph
Actual and forecast results for the current option selections are displayed for each item as below:

Graphical Adjustment Toolbar

You may modify calculated forecast values directly using the following buttons:
- Shift Up to shift the forecast values for unfrozen periods up at the current change rate
- Shift Down to shift the forecast values for unfrozen periods down at the current change rate
- Slope Up to increase the slope of forecast values for unfrozen periods at the current change rate
- Slope Down to decrease the slope of forecast values for unfrozen periods at the current change rate
- Use the Change Ratio slider to increase or decrease the current change rate
Freezing Cells
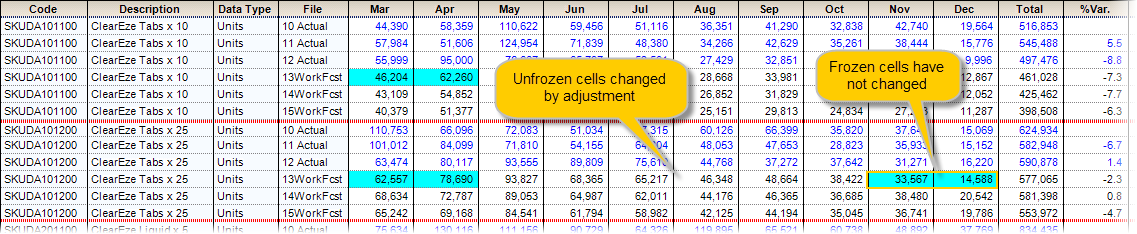
You can freeze any range of cells when adjusting your forecast. Frozen cells are not affected when you use options on the Graphical Adjustment toolbar. The example below shows the data editor prior to adjustment and then after a Slope Up adjustment was made.
Prior to Adjustment

After a Slope Up adjustment
Comments
0 comments
Please sign in to leave a comment.