
| Crosstab Name | Comparison of 12 month Totals |
| Description | Analyses differences in actual/forecast data for previous/next 12 months. |
| Number of Files | 3 Summary files required |
| Database Validity | Can be applied to all databases. |
| Variants | None |
| Extra Notes | Requires file 1 = PY Actual, file 2 = CY Forecast, file 3 = CY+1 Forecast. Does not use any classification variables, so is applicable to all sales databases. Selected period must be January to December. Variance option must be Period Totals only. |
Example
You would like to analyse variances between actual and forecast values for the previous/next 12 months.
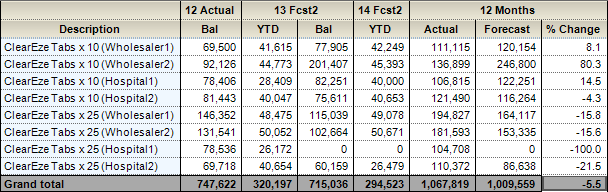
12 months totals = Sum of values for CM +1 to Dec + Sum of values from Jan - CM.

For example, if CY = 2013 and current month (CM) = 4 (April),
12 month total for actual = Sum May - Dec 2012 + Sum Jan - Apr 2013

For first item above, 12 month actual total = 69,500 + 41,615 = 111,115.
Download
For information on how to import this Crosstab Definition into your database please see How to Import a Crosstab Library File.
Comments
0 comments
Please sign in to leave a comment.