
When you create a graph in IFP, the default styles are used according to the type of graph being created. Graphs may be customised in many ways, including symbols, colours and a range of pattern and gradient effects.
- Open the graph you wish to customise.
- Go to Graph > Series OR right-click and select Series.
- Choose the Series to edit.
- Select Edit Styles to change the graph colours and apply fancy effects. The Chart Series Style dialog will open.
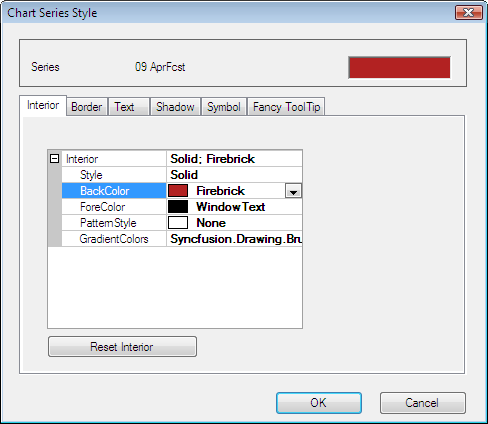
- Select the style would like to change (e.g. BackColor) and click on the arrow to show the selection of colours.
- Click OK to apply the new style.
Example
Suppose you wish to change the symbol on a line graph to a yellow triangle.
- Select the Symbol tab.
- Select Shape and select Triangle in the drop-down list.
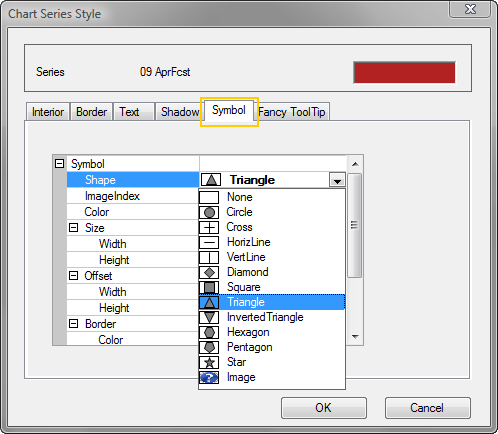
- Select Color and select Yellow from the drop-down list.
- Click OK to apply the style.

Note: It also possible to Apply a Gradient Background to a graph.
Comments
0 comments
Please sign in to leave a comment.