
Overview
You may wish to view and edit your data in a graphical format before finalising your forecast modifications. This is a quick and simple process in IFP.
Graphing Forecast Data
Selected Items
To create a graph for one or more products in your forecast, proceed as follows:
- Select all complete rows for each relevant product in the Forecast Editor
- From the toolbar select Report > Graph > Selected Items
This will display a graph similar to the below, showing all selected data: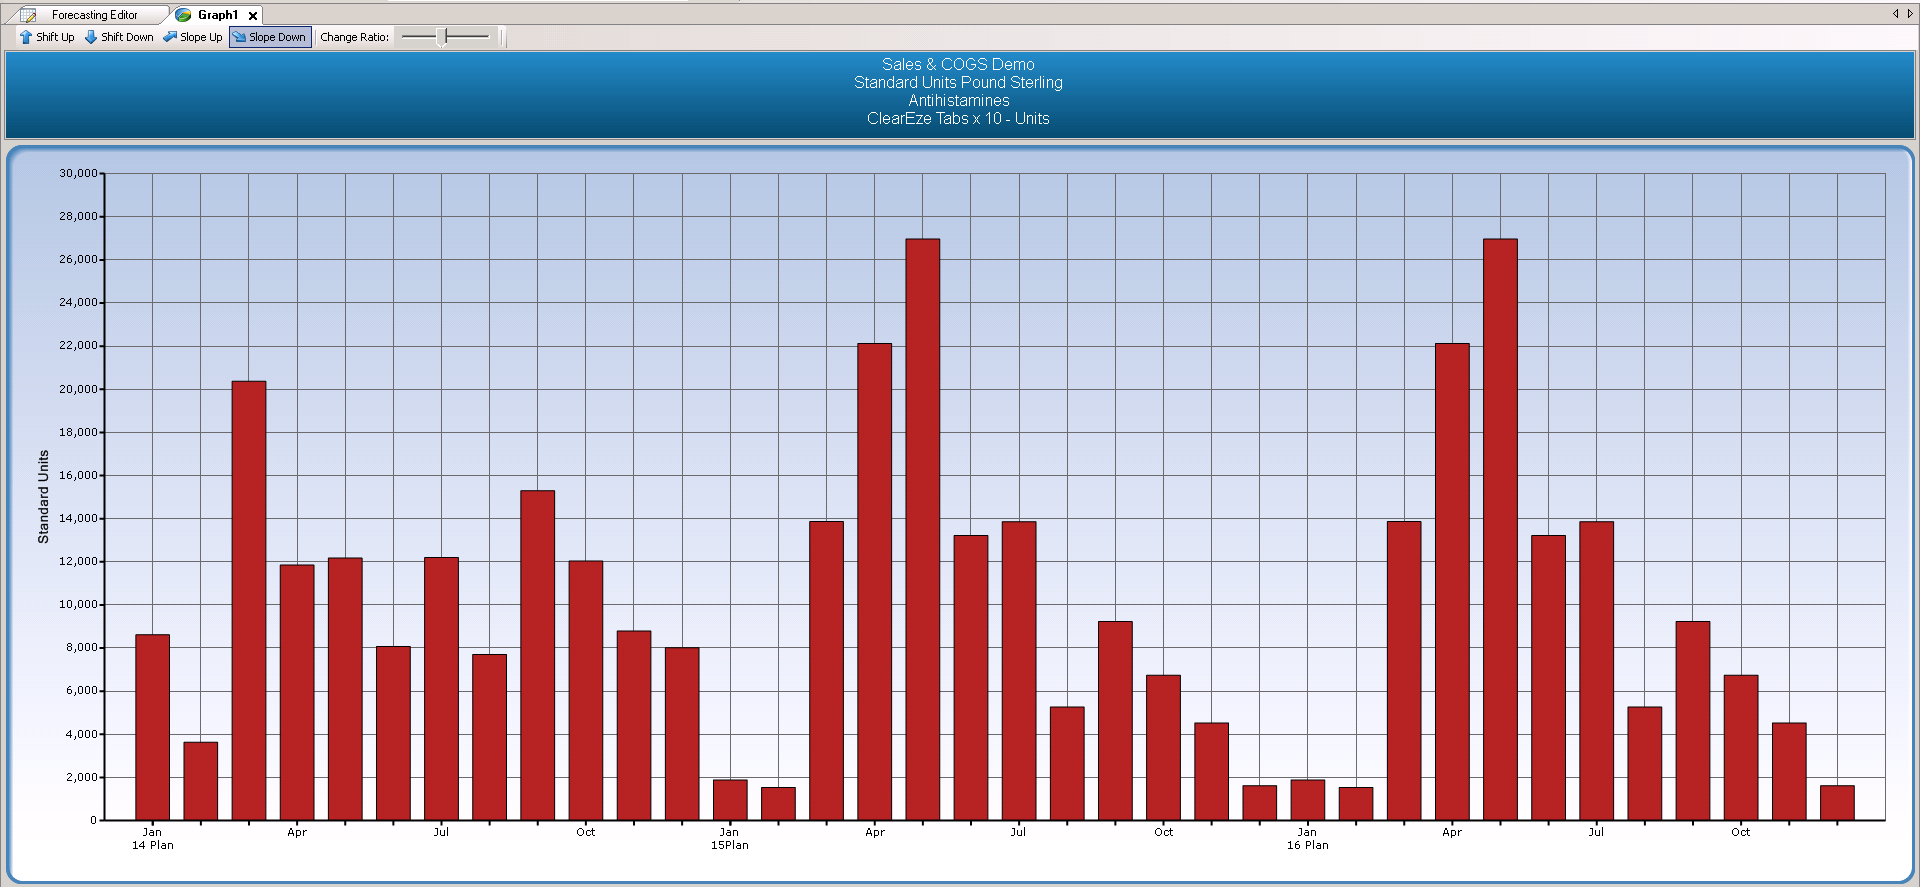
Comparing Files
To compare different files displayed in a Forecast Editor in the form of a graph:
- Select any relevant data you wish to display
- Select Report > Graph > Compare Files
This is known as a Series Comparison Graph.
Graph Types and Styles
You can change the type of graph used or the style of the graph type being used.
- To select an alternative graph type, see How to Change a Graph Type
- To modify graph style options, see How to Customise Graph Styles
Graph Favourites
You can save the graph type and style options in a Graph Favourite, to quickly access and apply to data in the future.
To use a pre-defined graph favourite, select Graph > Load Graph Favourite.
Comments
0 comments
Please sign in to leave a comment.