
The Custom File Selection page of the Reports Wizard allows you to directly specify the files, periods and any calculation options such as variances. 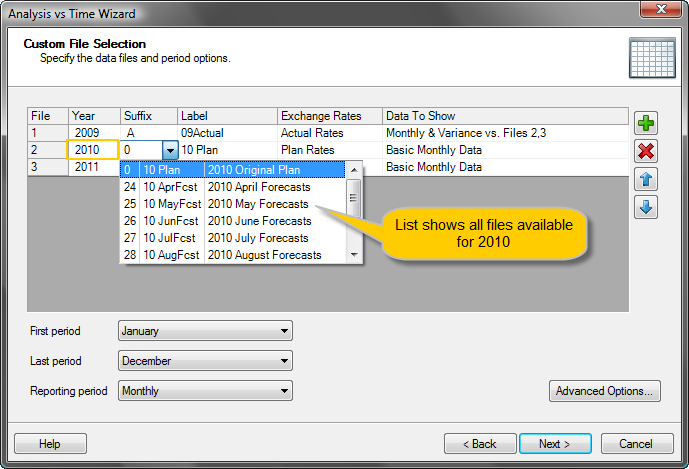
File Selection
The recommended method for file selection is to add the required number of files using the + button, then for each file:
- Select the Year.
- Select the Suffix from the drop-down list of available files (or enter directly).
- Edit the Label if required.
Note: Each file has a default file label, which is used for report headings etc. This default may be edited for individual reports. Permanent changes to default labels must be made via Data File Manager.
- Select the Exchange Rates.
Note: Where a report is in a currency other than base currency, IFP needs to know which table of exchange rates should be used to convert each monthly value into the selected currency. Each actual or budget file may be allocated to a particular default exchange rate table via Data File Manager. The default exchange rate table may be changed at any time and may be overridden when selecting options for any particular report or graph.
Normally a database will contain a number of exchange rate tables e.g. Actual Rates, Plan Rates and July Latest Estimate Rates. All actual files would normally be allocated to the default exchange rate table 'Actual Rates'. Note that exchange rate tables contain monthly rates for all years for all currencies. - Select the Data to Show
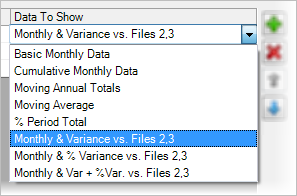
Only applies to Analysis vs Time reports and Graphs.
According to the type of report selected the user has a range of data options for presenting the selected data. For example, for ‘Analysis vs Time’ reports it is possible to show data as follows:
Variance Option
See Variance Options in Reports.
First/Last Period
The period to be included in all analyses/reports is selected by separately specifying the first and last period required. Any length of period may be selected. As an alternative to selecting a specific month, there are options to select Current Month, Next Month and Previous Month. These are particularly useful when creating a Data Favourites file as the period included will be relative to the current database month.
Where daily files are selected the first and last period are set in terms of trading day numbers (Day 1 to Day n).
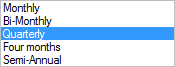
Reporting Period
Reports may be generated in terms of monthly, bi-monthly, quarterly, four months or semi-annual values.
Advanced Options
Different options are shown for each report type. Some reports do not have advanced options.
Rolling Periods
When selected, the Rolling Periods option produces a report that outputs all selected periods for all files on a single line.
Suppose the two files selected are 2009 forecast and 2010 forecast with a first month of July and a last month of December. This would produce a report with the whole period July 2009 through to December 2010 inclusive on a single line for each data type for each item.

Comments
0 comments
Please sign in to leave a comment.