
IFP allows you to view multiple reports and graphs on one screen. This feature is extremely flexible, allowing an almost unlimited and fully-customisable view of your data. You can rearrange your view by simply dragging reports / graphs with the mouse.
You can also use CTRL & click to show multiple graphs from the same package side-by-side.
- Create the report as normal e.g. by using a package.
- Select a range of items and create a graph using Report > Graph > Selected Items. The graph is created on a new tab.
- Select the new graph's tab with the mouse and drag it to the centre of the screen. A docking icon will appear, showing you where you can drag the tab to.
- As you hover over each part of the docking icon, the screen will be shaded to indicate where the tab will be moved to. Release the mouse over the docking icon on the right.
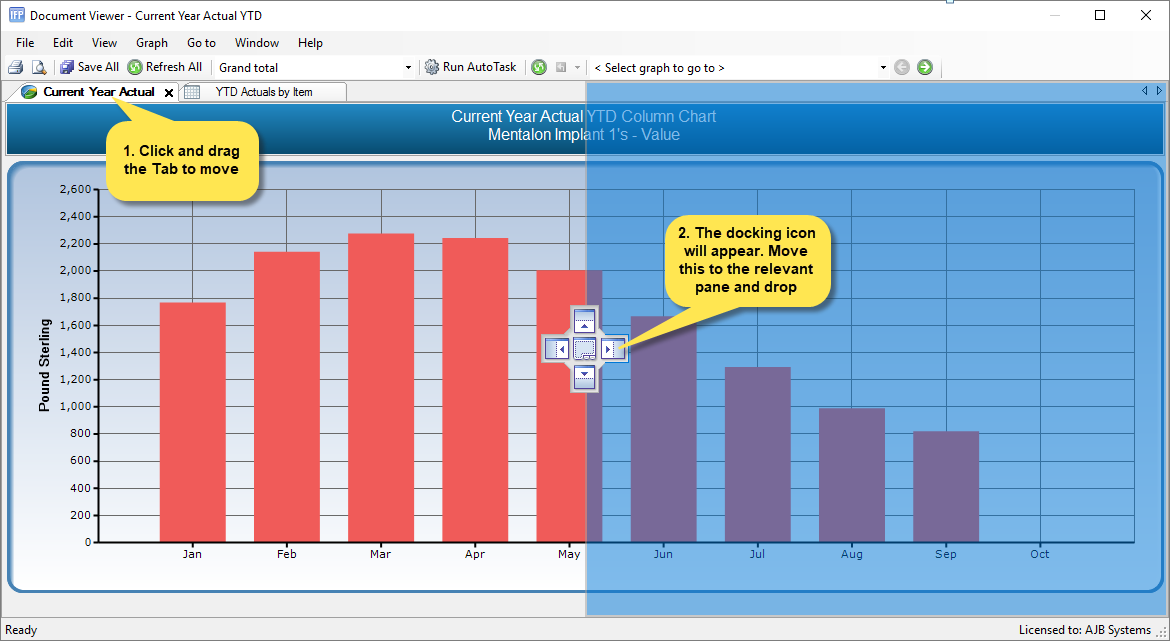
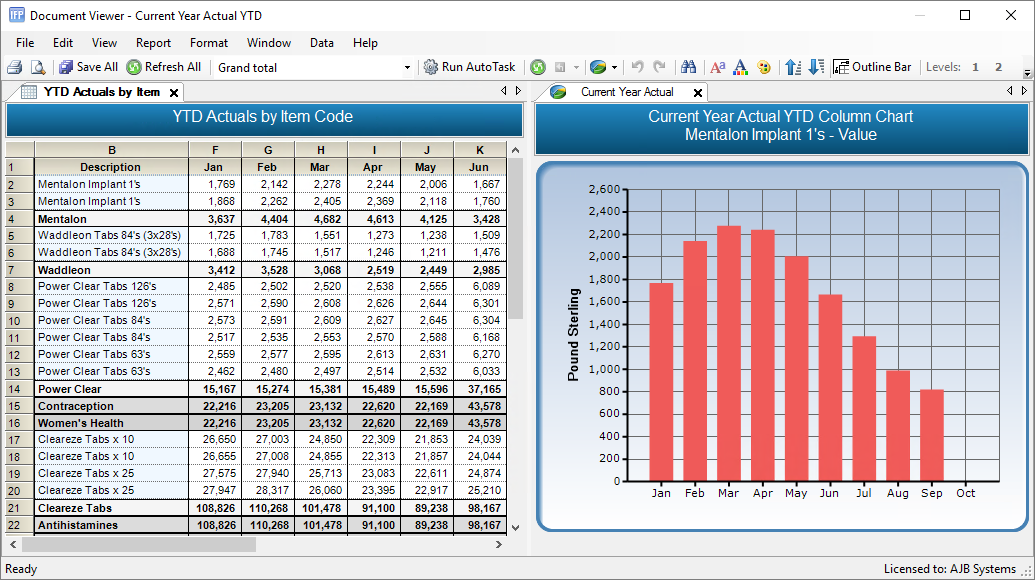
- The report will now appear on the left with the graph on the right.
Notes:
- There are 5 panes that each tab may be moved to. These are:

- You may create any number of split views, vertical or horizontal.
- You may also right-click a tab and select New Vertical Tab Group to achieve the same effect.
- To return all tabs to their default positions, select Window > Reset Window Layout.
- Split views may be saved as Dashboards, which can be opened with a single click from IFP Home.
Comments
0 comments
Please sign in to leave a comment.