
Note: These selections apply to Analysis vs Time reports only.
Graphs can be quickly and easily created from selected items on a report.
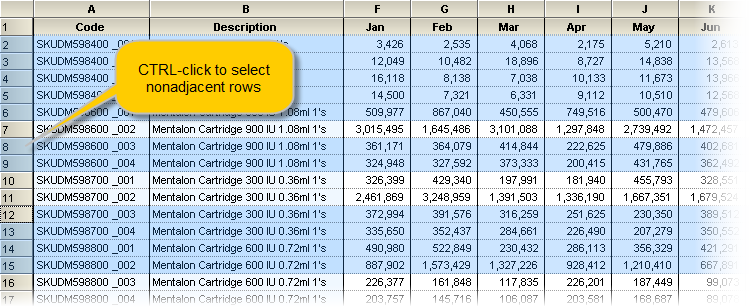
- Select the required items from the report. Use the Shift and Ctrl keys to select non-adjacent rows.
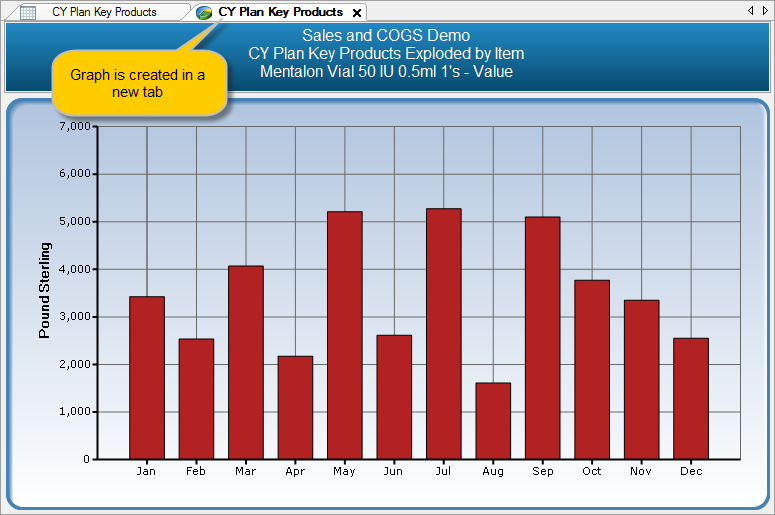
- Select Report > Graph > Selected Items from the menu. The graph is created in a new tab.
- If required, move the graph to view the report and graph side-by-side.
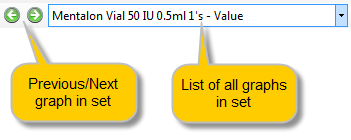
- To navigate through the selected items, use the drop-down list or previous/next buttons on the toolbar.
Note: In addition to graphs vs time, you may also create graphs comparing selected items or comparing selected files.
Comments
0 comments
Please sign in to leave a comment.