
Overview
An Outline Bar is available in many reports, allowing users to show or hide the different levels of the hierarchy of the selected items within a report or forecast editor.
This tool allows you to view the report at certain levels of detail which are important to you, without having to create a completely new report, meaning you can focus on points in the report without getting overwhelmed by the other data around it.
The Outline Bar
This function can be accessed from the toolbar by selecting Data > Outline Bar in both Reports and some Editors. Repeat this process to switch it off again.
When first selected the report will Show All of the available data in the report and will be expanded as much as it can. You can go back to this level of detail by pressing on Show All at any time.
There are two ways that you can change the view from Show All.
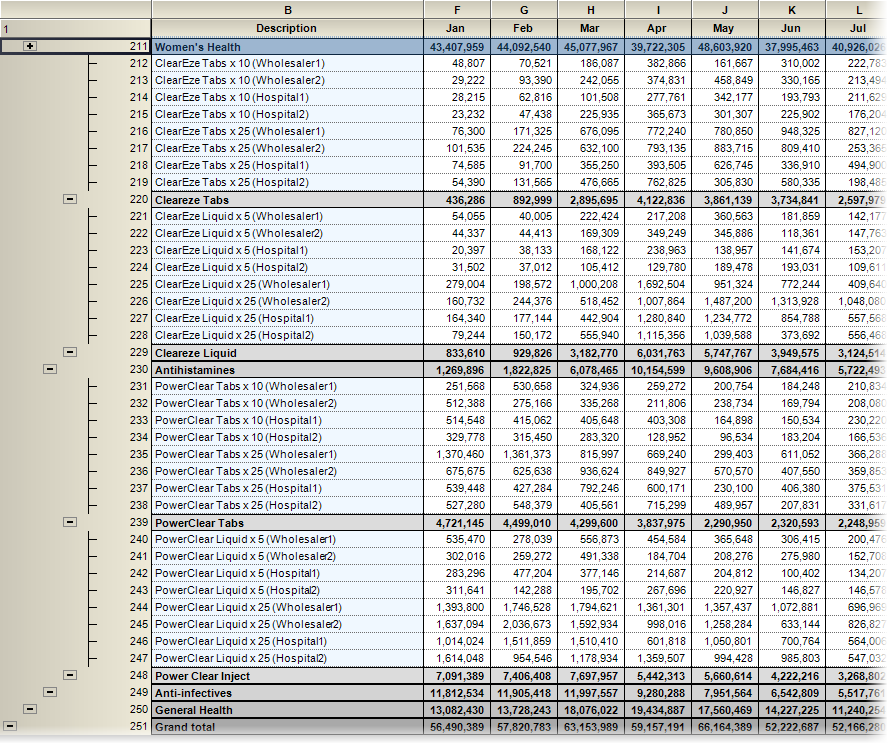
- Using the plus and minus buttons on the left-hand side of the report. These buttons allow you to expand or collapse the information you see for specific areas of a report, as can be seen from the screenshot below.
- Choose Levels between 1 and 4 on the Outline Bar toolbar.
Plus and Minus Buttons
Pressing the plus or minus buttons will have varying effects depending on which Level button you press. When for instance you minimise a Level 2 button, all associated Level 3 and Level 4 information will be hidden and just the Level 2 information will show.
Being able to adjust this report using the plus and minus buttons gives you complete flexibility over how you view the data that is important to you.
Levels 1 - 4
These buttons, available in the Outline Bar Menu, will provide you with a report based on the Level that you choose giving these at a total level.
Once again these will also show totals in Levels above, but not below it. You can still expand and minimise the report by pressing on the plus and minus buttons here to create your desired report.
Level 4 Report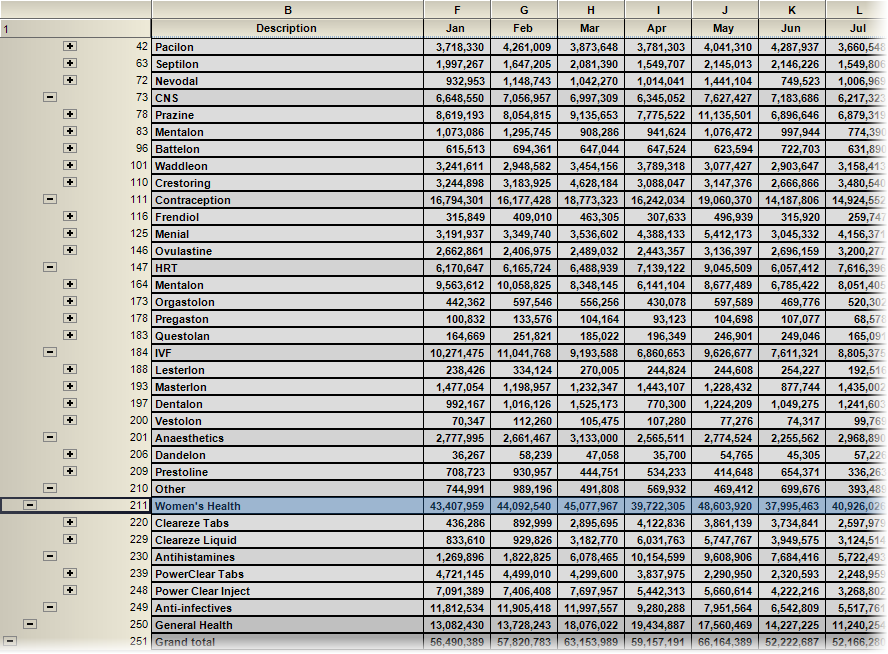
Level 2 Report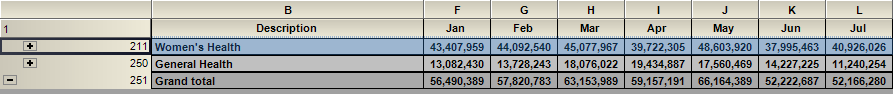
Comments
0 comments
Please sign in to leave a comment.