
Overview
Standard format Month & YTD Variance reports in sales databases include columns for just one data type (either units, value or ASP). In some cases, you may wish to create a single report including relevant columns for two or more data types (e.g. units, value and ASP).
This can be achieved in a very flexible manner using Crosstabulation Analysis.
Crosstabulation Definition
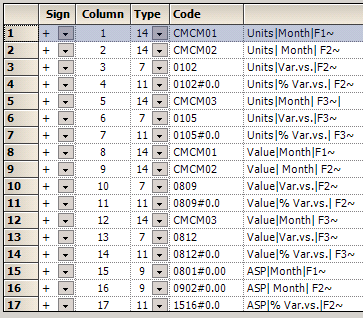
A comprehensive crosstabulation definition is shown below. This definition is written in a generic manner allowing the use of any 3 selected files.
Note the following aspects of this definition:
Column 1
Type   = 14 (Selected File/Period Column)
Code   = CMCM01 (Current month value for file 1)
Header = Units|Month|F1~ (1st line = Units, 2nd line = Month, 3rd line = file 1 label)
Column 3
Type   = 7 (Variance Column X vs Column Y)
Code   = 0102 (Column 1 vs Column 2)
Header = Units|Month|F1~ (1st line = Units, 2nd line = Var. vs., 3rd line = file 2 label)
Column Header Merging
Columns 1 to 7 use exactly the same first header line (Units) to ensure that headers for these columns are merged.
Columns 1 to 2 use slightly different 2nd line headers of 'Month' and ' Month' to ensure that headers for these columns are not merged.
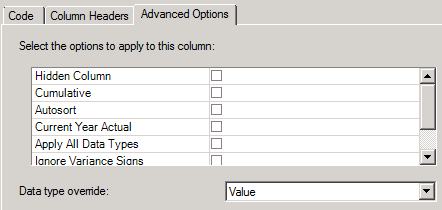
Advanced Options
Note the use of Advanced Options > Data type override to set the data type to be used for each column. For example, columns 8, 9 and 12 have 'Data type override' set to Value.
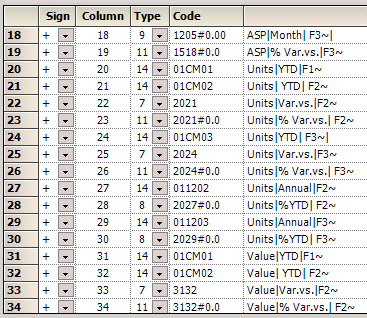
Column Definitions

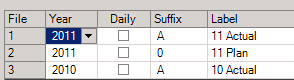
Option Selections
To create the report proceed as follows:
- From IFP Home, select Crosstabulation Analysis > Custom File Selection and select any 3 files. Note that file 1 should normally be CY actuals. Files 2 and 3 may be any other files (typically plan and PY actuals).
-
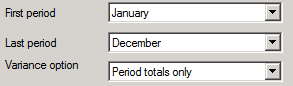
Note that you should select the full year (January to December) for this report. You must not select any variance option 'Period totals only).
- You may select any options for the following:
- Report definition
- Items
- Levels of detail
- Inclusion options (only one data type may be selected, but the report includes all data types)
- Crosstabulation Definition should be Month&YTDVariance_UnitsValueASP_3Files
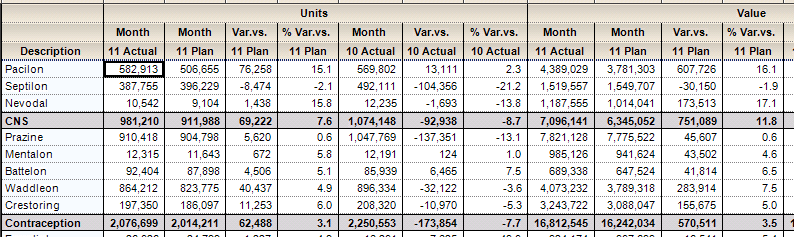
Example Report
A small part of the resulting report is shown below. The complete example report is attached to this topic (Month&YTDVariance_UnitsValueASP_3Files.xls).
Adding Crosstabulation Definition to Your Database
The attached definition may be installed in any sales database as follows:
- Save the attached file, Month & YTD Variances Units, ASP, Value (3 Files).ifp, in any convenient folder on your local server
- In your sales database, select Reporting > Crosstabulation Manager
- Select the General folder.
- Click Tools > Import and select the file you saved in step 1.
Variants
Variants of the above report may easily be constructed.
Excluding ASP Columns
If a report is required without showing ASP columns then a copy of the above definition may be created with the advanced option Hidden column set for all ASP columns
YTD Analysis Only
If a report is required without showing YTD analysis only then a copy of the above definition may be created with the advanced option Hidden column set for all 'Month' columns.
Alternatively, a copy may be created with all Month columns removed. However, this will require careful editing of calculated column definitions.
Downloads
Below are example check reports and crosstab definitions for Month & YTD variances, in both the 3 file format and the 2 file format.
Comments
0 comments
Please sign in to leave a comment.